Power BI Projects
Data Driven Education
The report represents a detailed analysis of student performance across different school years, semesters, schools, etc., for Fort Vermilion School Division - Alberta, Canada.
Data Analysis Goals
-
Showcase the average score trend throughout the years/semesters
-
% of students (calculated from the total number of students) per each assessment level group broken down by
o Semester (Fall, Winter, & Spring)
o School Year
o School
-
High-Level Public School and La Crete High School stand out with the highest student numbers.
-
The Average Score is 93.6 which is high during the Spring Semester
-
Distribution of Very Poor Scoring Students from different Schools
-
Showing the Top Performing School by Average Score
-
62 % of Schools are from Rural municipalities
Outcome
Marketing Ads Analysis
This Dashboard contains an Amazon Ads analysis project based on an Amazon bookseller
Data Analysis Goals
-
Identify which campaigns and ad groups have the highest RoASs.
-
Identify which keywords are getting the most impressions and trends in impressions and clicks over time.
-
Use this information to decide which campaigns and ad groups to allocate more budget.
Outcome
● The data shows that total impressions have fallen by 57.77% from 2021 to 2022. This suggests that her products are becoming less visible in search results.
● Suggested to Optimize the product titles and descriptions to include relevant keywords that people are likely to search for.
Supply Chain Analysis
A DataSet of Supply Chains used by Amazon will be used for the analysis. Dataset of Supply Chain, which allows the use of Exploratory Data Analysis,
Data Analysis Goals
-
Status of orders and Deliveries (number of orders by current status)
-
Finding the Top 10 Most ordered products, profitable categories, Profit orders/value by time (by each month, year, quarter)
-
Order profit per order by time (by each month, year, quarter)
-
Top payment methods by each product category and Inventory Value and Units by each class
-
Late Delivery Risk by time (by each month, year, quarter) and finding efficient shipping mode.
Outcome
● Order quantity is also down significantly. There were 7,000 units ordered this month, compared to 15,000 units ordered last month. This represents a decrease of 55.7%.
● Profit is also down significantly. There was a total profit of $253,040 this month, compared to $467,820 last month. This represents a decrease of 45.9%.
● Standard Class is the most popular shipping mode, accounting for 2,2260 orders (86%).
● The Consumer segment is the largest customer segment, accounting for 3,450 orders (52%).
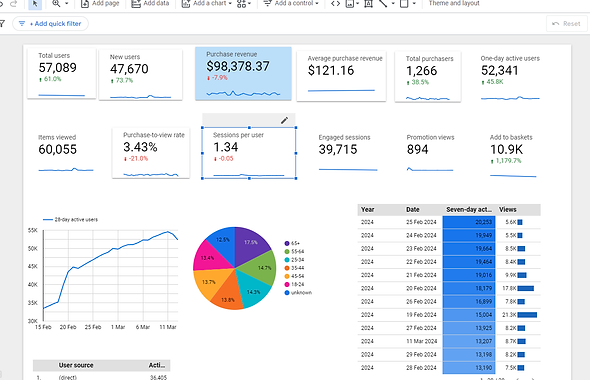
Google Shopping Metrics Dashboard
This is a dashboard that tracks website revenue and expenses, along with other website metrics.
Other metrics tracked include items viewed, purchase-to-view rate, sessions per user, and engaged sessions.
Outcome
● It shows that total revenue is $98,378.37, with an average purchase revenue of $121.16.
● There were 1,266 total purchasers, 57,089 total users. Total users increased 61 % compared to last month.